Summary
The Sales Queue Dashboard provides key data about new leads and the processing of them.
Goals
The goals of the dashboard are to allow insight into the following areas in order to:
- See how many leads have been presented to agents.
- See how many leads have yet to reach an agent.
- See how many leads have not reached an agent in time.
- Show the impact of new leads vs journey leads that need presenting again.
- Monitor if customers are stuck in the queue.
View Options
 The dashboard can be viewed for Today where data is shown for the current day and broken down by hour.
This Week shows data for the last 8 days and for tomorrow. The purpose of this is to be able to see the same day from last week in case there are any patterns to be aware of e.g. Monday mornings tend to have high inbound calls which will impact the processing of journey items. Tomorrow shows any journey items that are scheduled to be called again for tomorrow which allows an element of planning ahead if there are an abnormal number of calls scheduled.
Types of Data
New Leads
For new leads the data relates to when the lead was created and whether it met the SLA or not.
Presented On Time
The lead was presented to an agent before the SLA was due.
Pending
The lead has not yet been presented to an agent but the SLA is not due yet.
Presented Late - Missed SLA
The lead has been presented to an agent but the SLA was missed.
Not Presented - Missed SLA
The lead has yet been presented to an agent and the SLA was missed.
Journey Leads
For journey leads the data relates to whether the lead has been presented before the end of the next attempt or not. For example if the lead is on Attempt 2 then we are measuring that the lead was presented on Attempt 2 and not after Attempt 3 has become due.
Presented On Time
The lead was presented to an agent at the current attempt.
Pending
The lead has not yet been presented to an agent but there is still time at the current attempt.
Presented Late
The lead has been presented to an agent but it was after the current attempt and strayed into the time of the next attempt.
Not Presented
The lead has not been presented to an agent and it has strayed into the time of the next attempt.
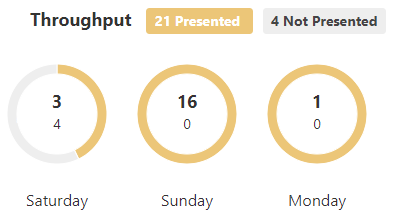
Throughput
This section summaries each hour or day and allows for an 'at a glance' view of throughput where it's clear there's a problem if the charts are predominantly grey. The Data is split into:
- The total number of leads Presented (Presented on Time + Presented Late)
- The total number of leads Not Presented (Pending + Not Presented) for New and Journey leads.
The Total Presented number is shown as the larger number in the centre of the charts and the Total Not Presented is shown below.
New & Journey Leads Charts
These charts show each type of data displayed as a stacked bar chart in order to show the details how effectively the leads are being processed through the contact centre.
Holding your mouse over each bar segment will show the details in a tooltip.

Was this article helpful?
That’s Great!
Thank you for your feedback
Sorry! We couldn't be helpful
Thank you for your feedback
Feedback sent
We appreciate your effort and will try to fix the article